Treatment with CRYSVITA® in adults with XLH demonstrated significant improvement in phosphate levels, measures of osteomalacia, pain, stiffness and mobility1,3
Table of Contents
Phase III efficacy and safety
Efficacy and safety of CRYSVITA® in adults with XLH have been investigated in a phase III study1
Study design1,2
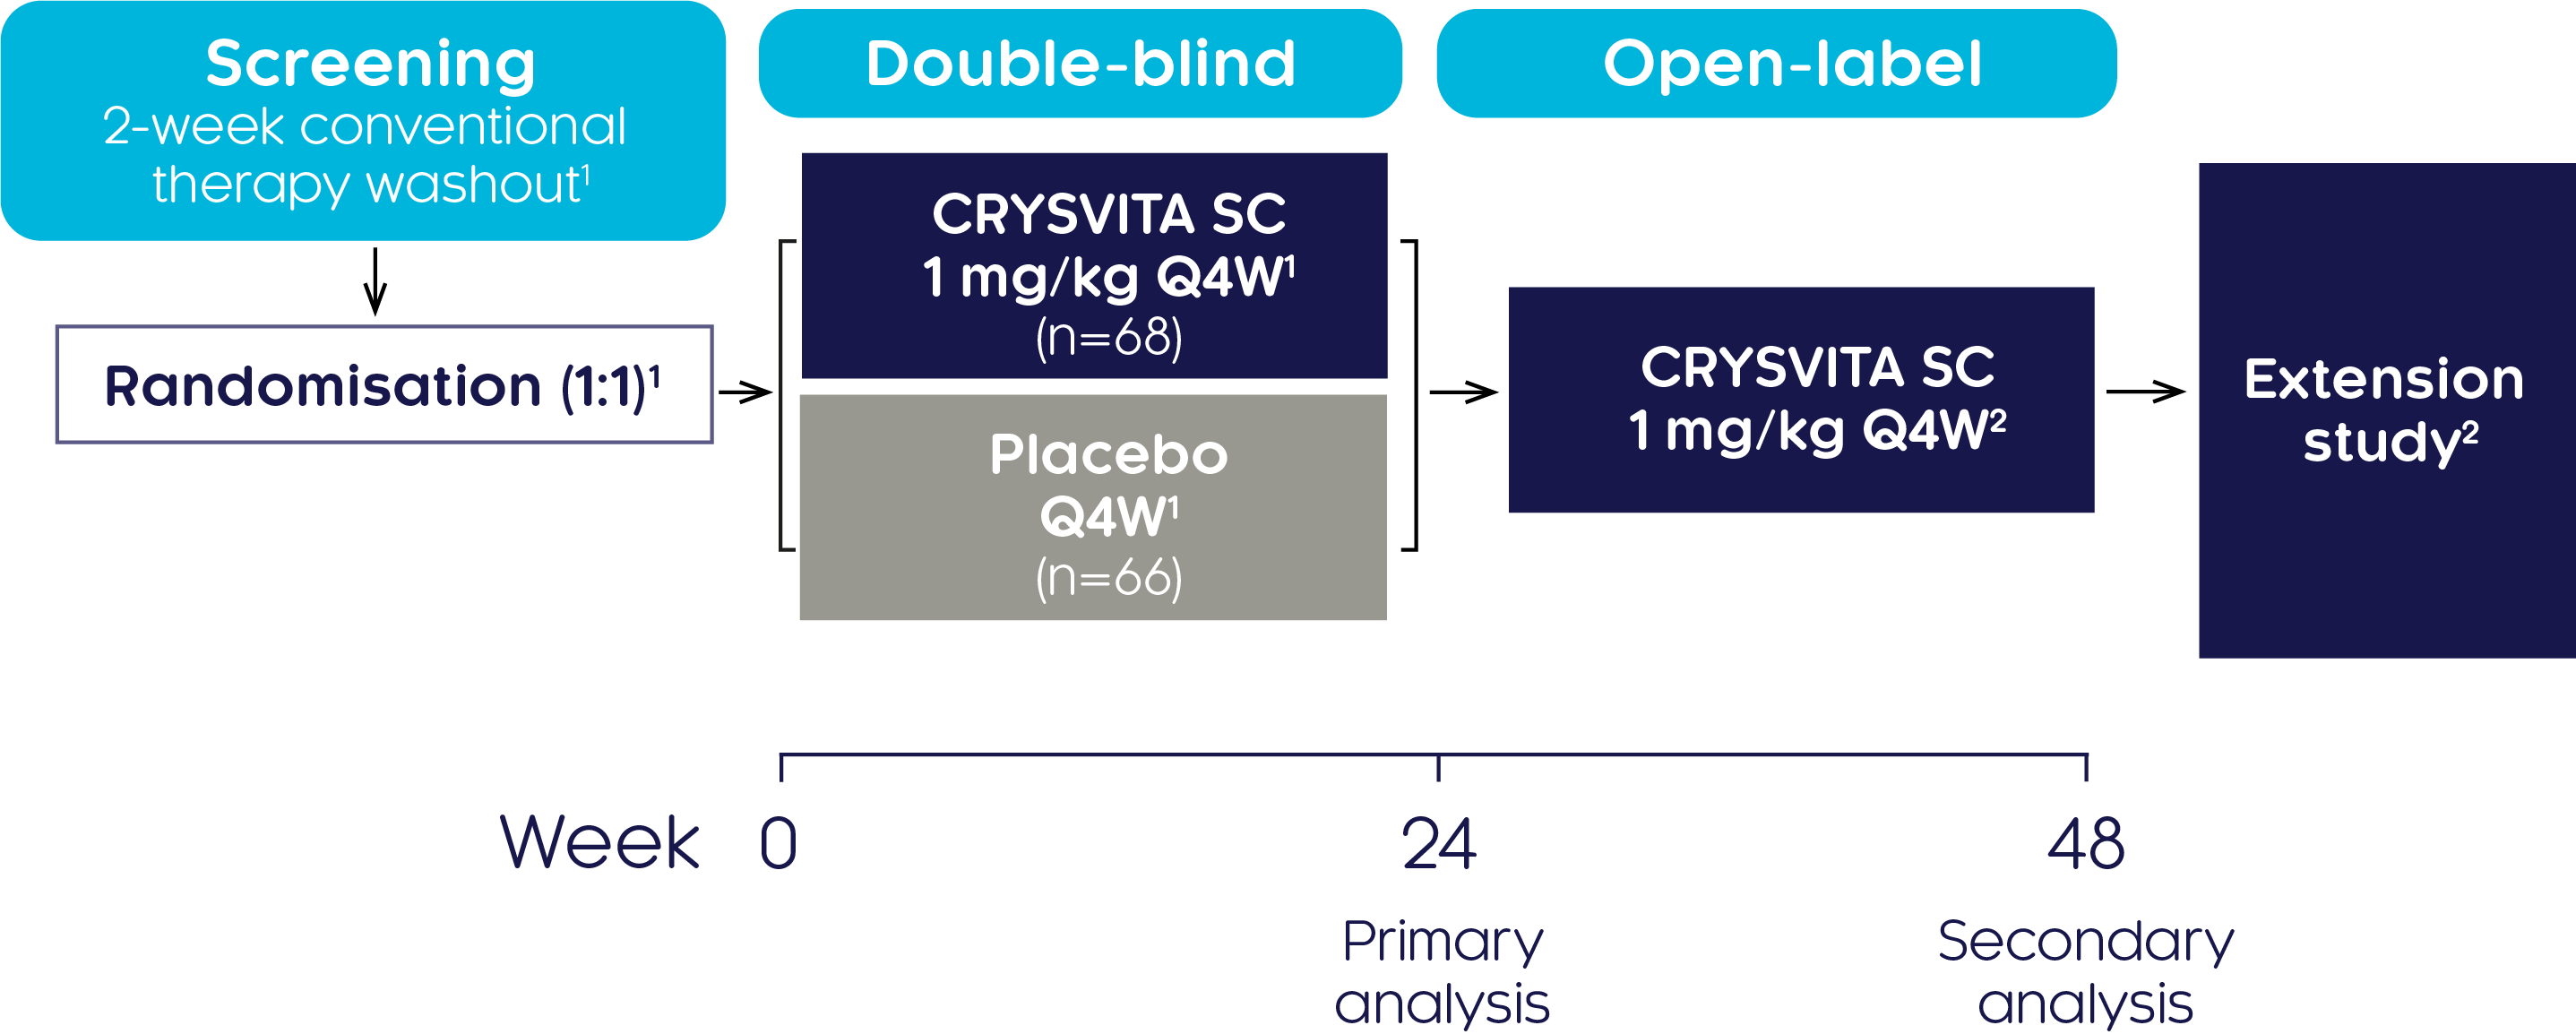
A randomised, double-blind, placebo-controlled, phase III trial was conducted at 25 centres internationally to investigate the efficacy and safety of CRYSVITA® in 134 adults with XLH aged 18–65. The double-blind, placebo-controlled period was 24 weeks followed by a treatment continuation phase of 24 weeks.
| Study population (N=134):1 | |
|---|---|
| Aged 18 to 65 years | TmP/GFR <2.5 mg/dL |
| A diagnosis of XLH supported by a confirmed PHEX mutation) | BPI worst pain score ≥4 |
| Serum phosphate below the lower limit of normal (LLN), 2.5 mg/dL (0.81 mmol/L) | |
Primary endpoint1,2
- Proportion of subjects achieving a mean serum phosphate concentration above the LLN of 2.5 mg/dL (0.81 mmol/L) at the mid-point of the dose interval, as averaged across dose cycles between baseline and Week 24
Secondary endpoints1,2
- Patient-reported outcomes: Changes from baseline to Week 48 in BPI worst pain score, and WOMAC scores for stiffness and physical function, measured every 12 weeks
- Changes from baseline through to Week 48 in biochemical markers: TmP/GFR and 1,25(OH)2D
- Changes from baseline through to Week 48 in bone remodelling markers: P1NP, CTx and BALP
Exploratory endpoints (assessed every 12 weeks)1,2
- Change from baseline to Week 48 in number of active pseudofractures or fractures
- Change from baseline to Week 48 in total distance walked during the 6MWT
Safety Endpoints1,2
- Incidence of adverse events and serious adverse events
Patient characteristics at baseline2
| Characteristic | Characteristic Placebo → CRYSVITA® (n=66) |
CRYSVITA® → CRYSVITA® (n=68) |
|---|---|---|
| Mean age, years (SD) | 38.7 (12.8) | 41.3 (11.6) |
| Female, n (%) | 43 (65.2) | 44 (64.7) |
| WOMAC stiffness†, mean (SD) | 61.4 (20.8) | 64.7 (20.3) |
| WOMAC physical function†, mean (SD) | 43.9 (19.9) | 50.8 (19.7) |
| BPI worst pain‡, mean (SD) | 6.5 (1.4) | 6.8 (1.3) |
| TmP/GFR§, mg/dL, mean (SD) | 1.6 (0.37) | 1.7 (0.40) |
| Serum phosphate§, mg/dL, mean (SD) | 1.9 (0.32) | 2.0 (0.30) |
| Serum 1,25(OH)2D§, pg/mL, mean (SD) | 33.5 (15.6) | 32.4 (13.0) |
| Enthesopathy on X-ray, n (%) | 65 (98.5) | 68 (100.0) |
| Unhealed fracture/pseudofracture, n (%) of participants | 38 (57.6) | 32 (47.1) |
| No. of fractures/pseudofractures | 91 | 65 |
| Fractures | 13 | 14 |
| Pseudofractures | 78 | 51 |
†On a normalised scale from 0 (best health state) to 100 (worst health state). ‡On a scale of 0 (no pain) to 10 (worst pain). §Normal ranges: TmP/GFR, 2.5–4.2 mg/dL; phosphate, 2.5–4.5 mg/dL; 1,25(OH)2D, 18–72 pg/mL.1
Phosphate regulation (CRYSVITA® vs placebo)
CRYSVITA® restores phosphate homeostasis in adults with XLH2
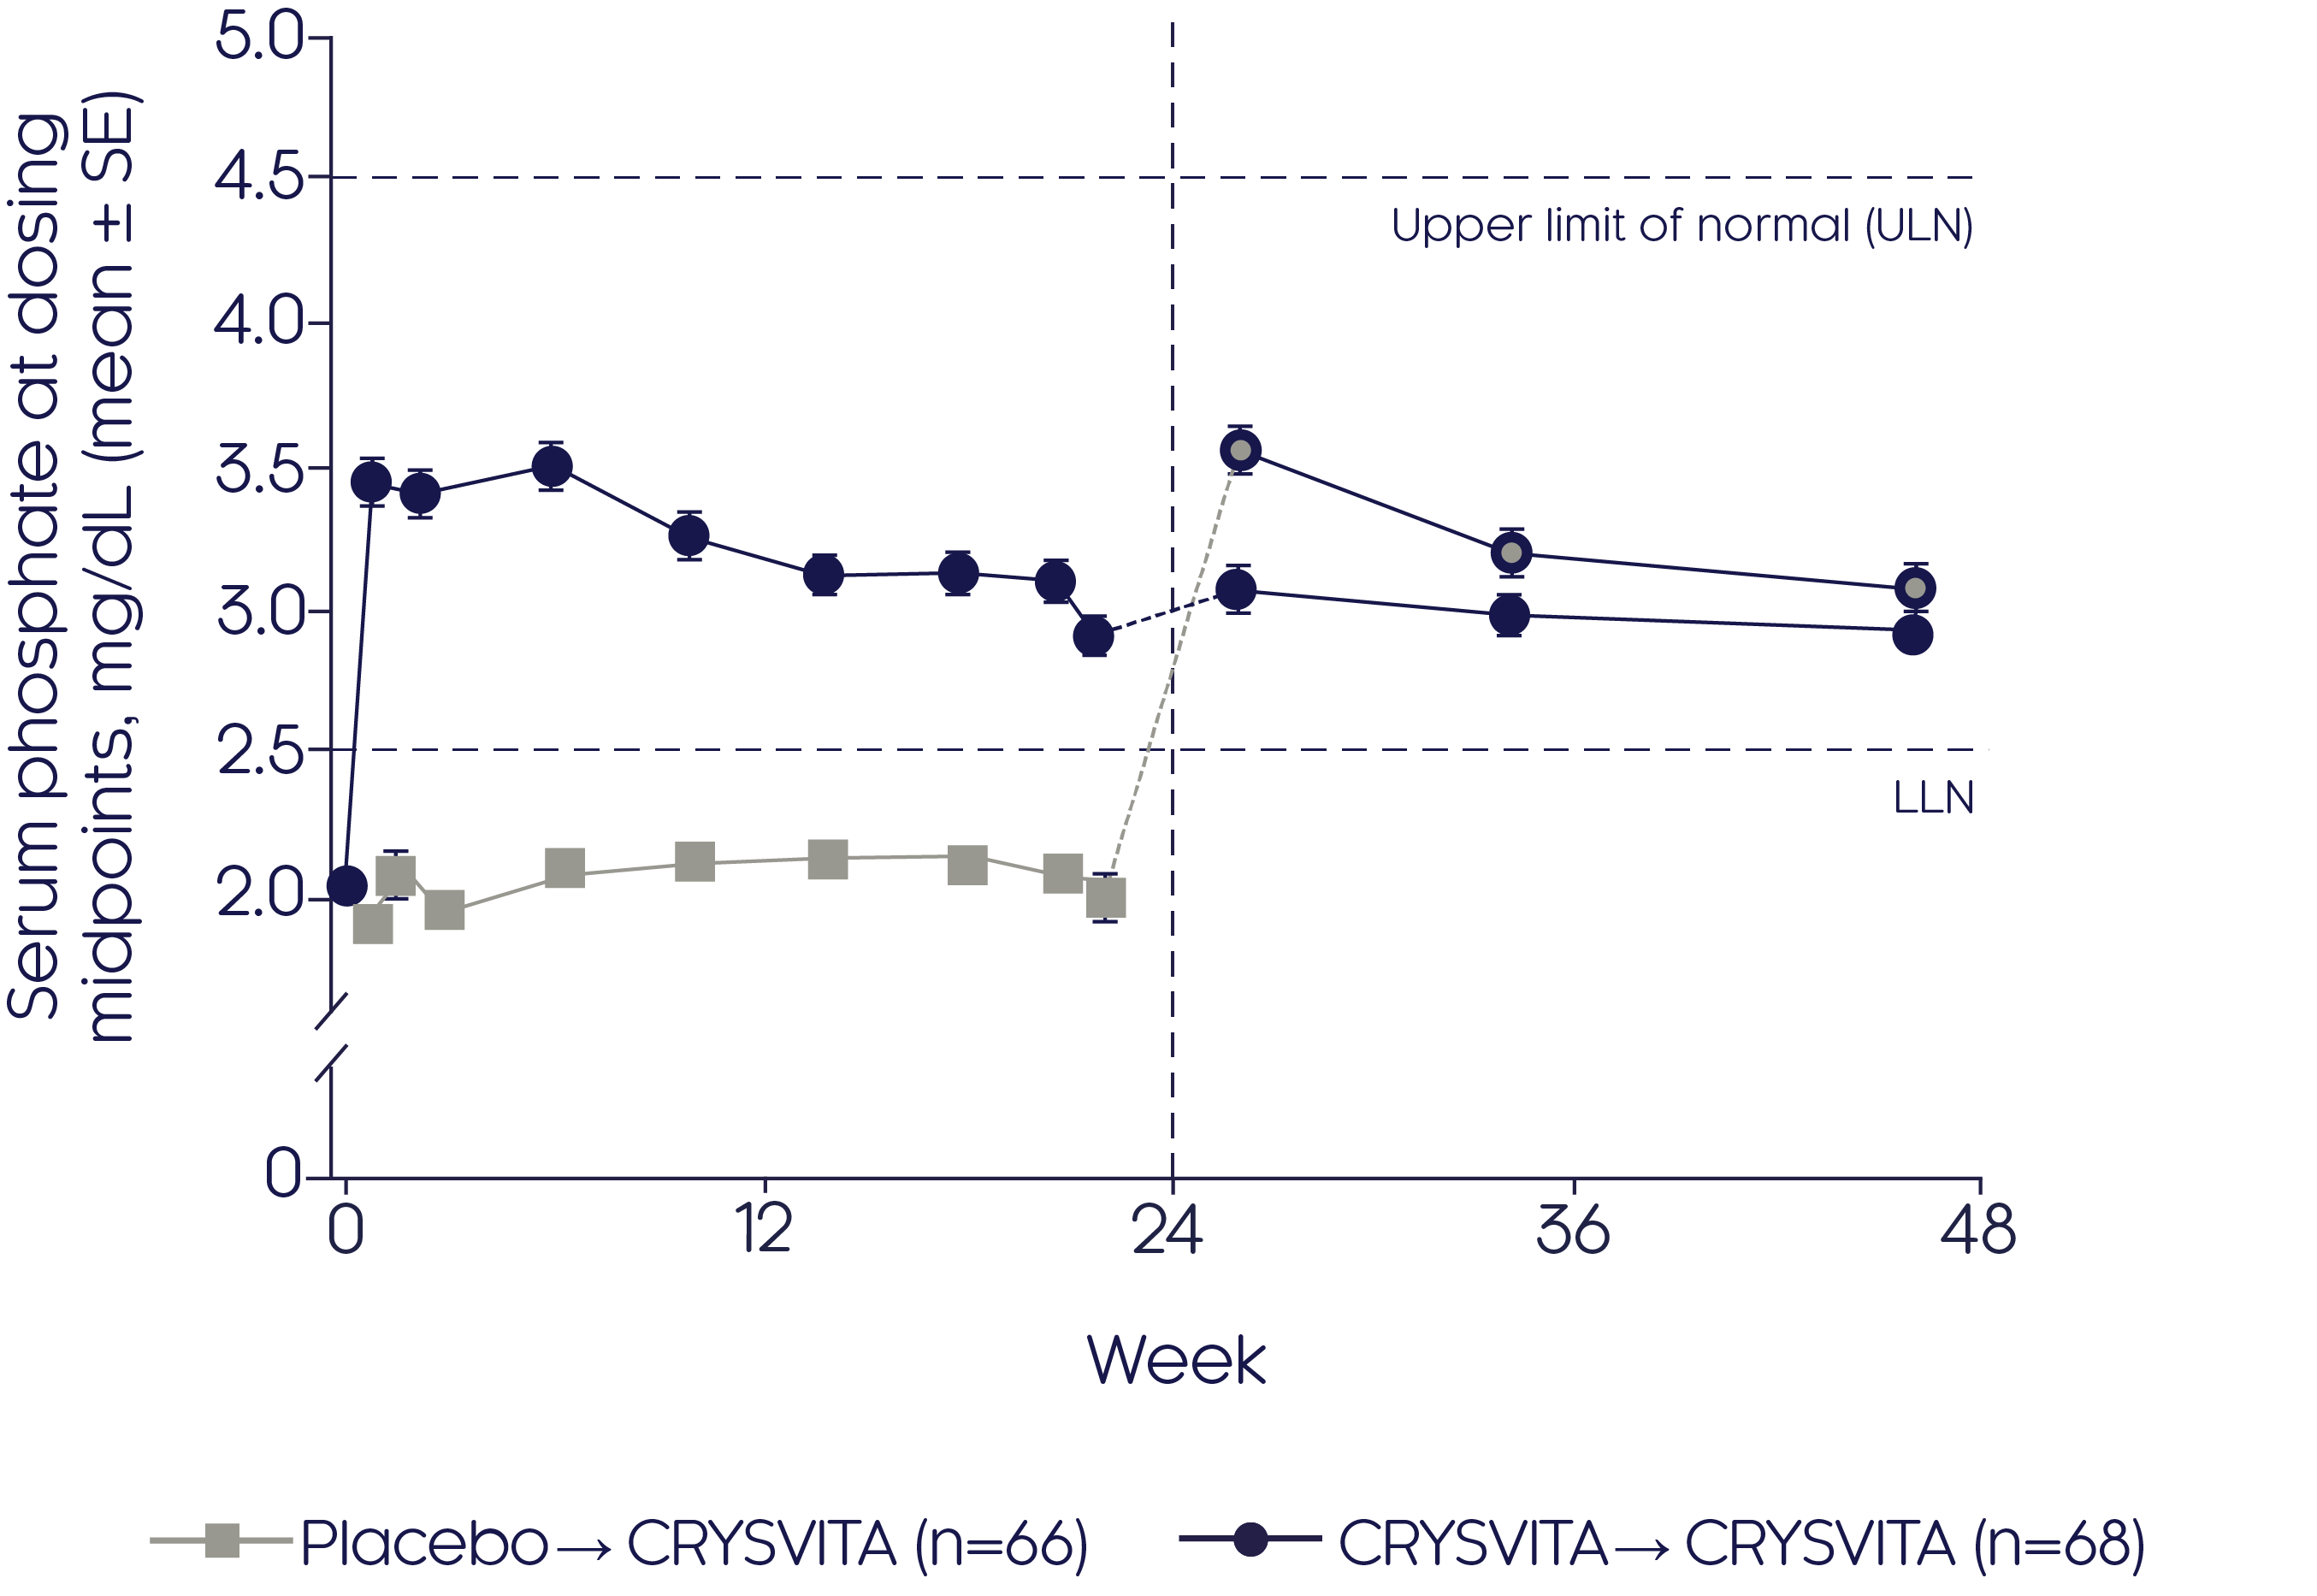
CRYSVITA® achieved mean serum phosphate levels above the LLN as early as Week 1, which was sustained over a period of 22 weeks compared with placebo (p<0.001)2
Mean change in serum phosphate2
Adapted from Portale AA, et al, 20192
- Improvements in mean serum phosphate were sustained over the 24-week open-label continuation period in the CRYSVITA® group (p value NR)
- CRYSVITA® treatment initiated at Week 24 in the placebo group promptly increased mean serum phosphate concentrations that remained at or above the LLN during the 24-week open-label continuation period (p value NR)
CRYSVITA® achieved significantly (p<0.001) greater TmP/GFR as early as Week 2, which was sustained over 24 weeks compared with placebo2
Mean change in TmP/GFR2

Adapted from Portale AA, et al, 20192
- Improvements in TmP/GFR were sustained over the 24-week open-label continuation period in the CRYSVITA® group (p value NR)
- Initiation of CRYSVITA® treatment in the placebo group showed an increase in TmP/GFR from baseline to the end of the 24-week open-label continuation period (48 weeks from baseline, p value NR)
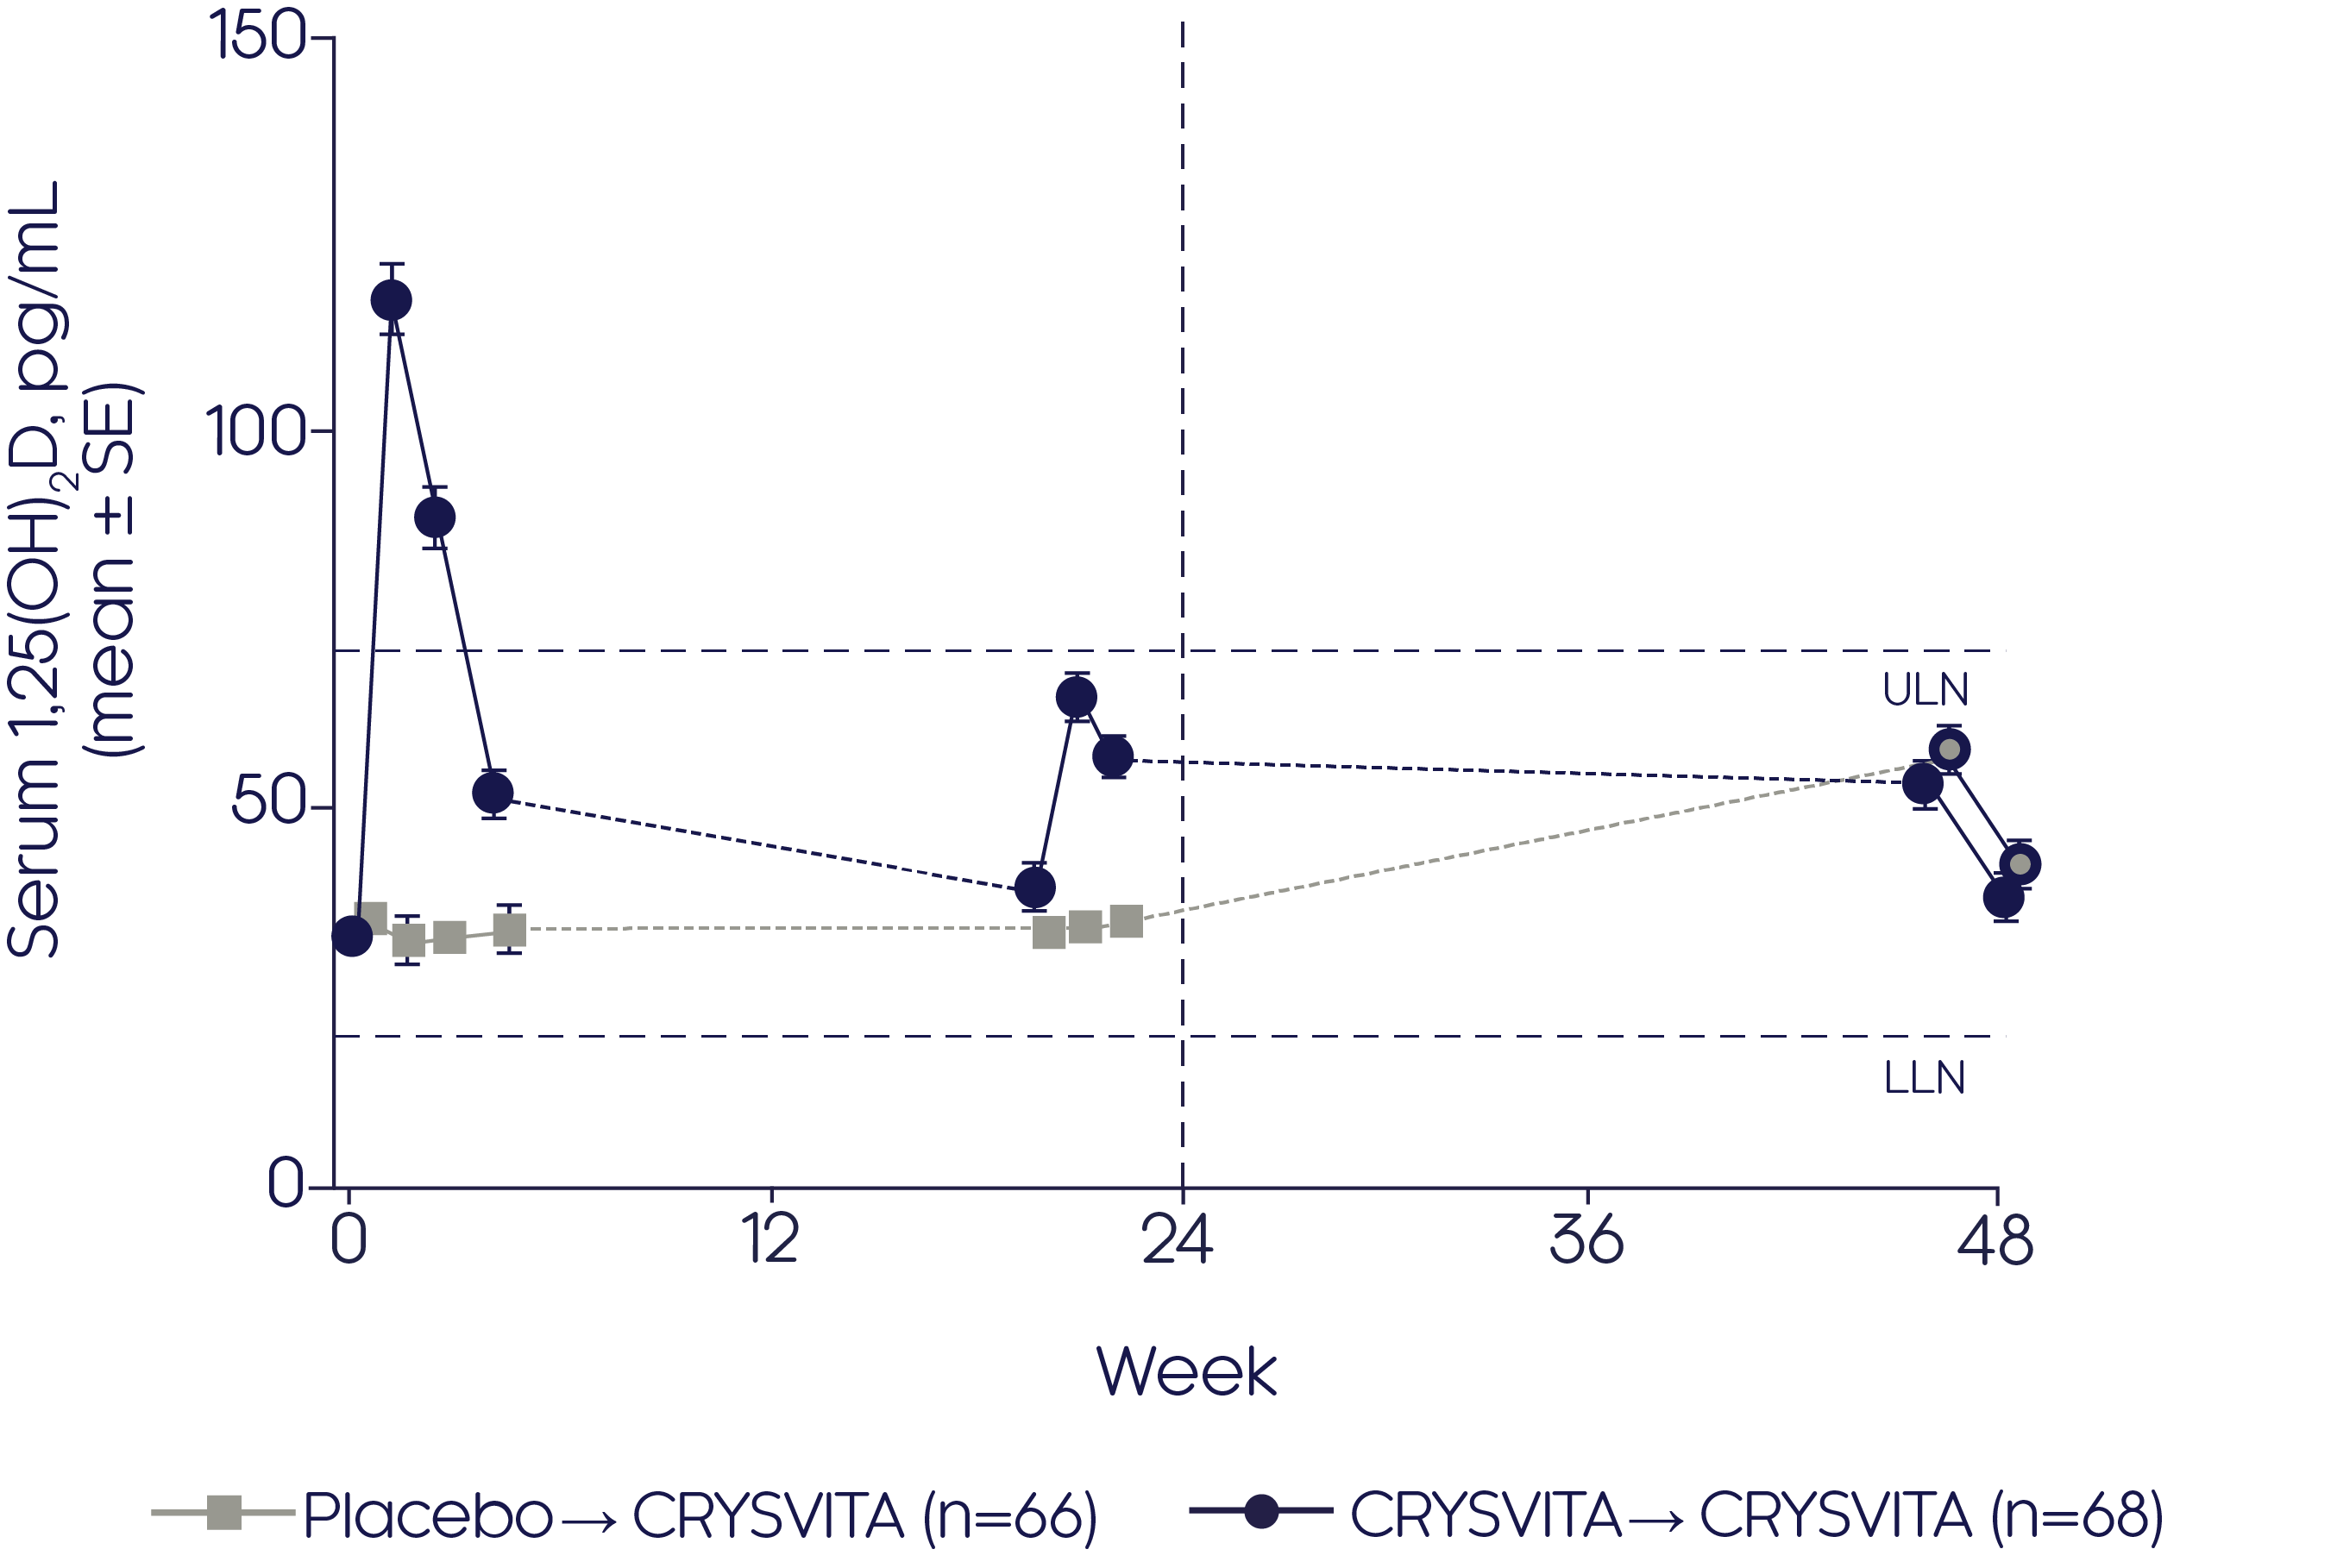
CRYSVITA® achieved significantly (p<0.001) greater increases in serum 1,25(OH)2D compared with placebo over 22 weeks2
Mean change in serum 1,25(OH)2 D2
Adapted from Portale AA, et al, 20192
- CRYSVITA® achieved an increase in 1,25(OH)2D from baseline to the end of the 24-week open-label continuation period (48 weeks from baseline) in the CRYSVITA® group (p value not reported)
- Initiation of CRYSVITA® treatment in the placebo group showed an increase in 1,25(OH)2D from baseline to the end of the 24-week open-label continuation period (48 weeks from baseline, p value not reported)
Pain, stiffness, physical function and mobility
CRYSVITA® improves pain, stiffness, functional disability and mobility in adults with XLH2
CRYSVITA® significantly (p<0.001) improved BPI worst pain score from baseline to Week 48 in the CRYSVITA® - CRYSVITA® group2
Mean change in BPI worst pain score2

Adapted from Portale AA, et al, 20192
- CRYSVITA® also significantly (p<0.001) improved BPI worst pain score from Week 24 to Week 48 after treatment initiation in the placebo-CRYSVITA® group2
*p<0.001 for least squares (LS) mean change from baseline to Week 48 (CRYSVITA® → CRYSVITA®), **p<0.001 for LS mean change from Weeks 24 to 48 (placebo → CRYSVITA®).
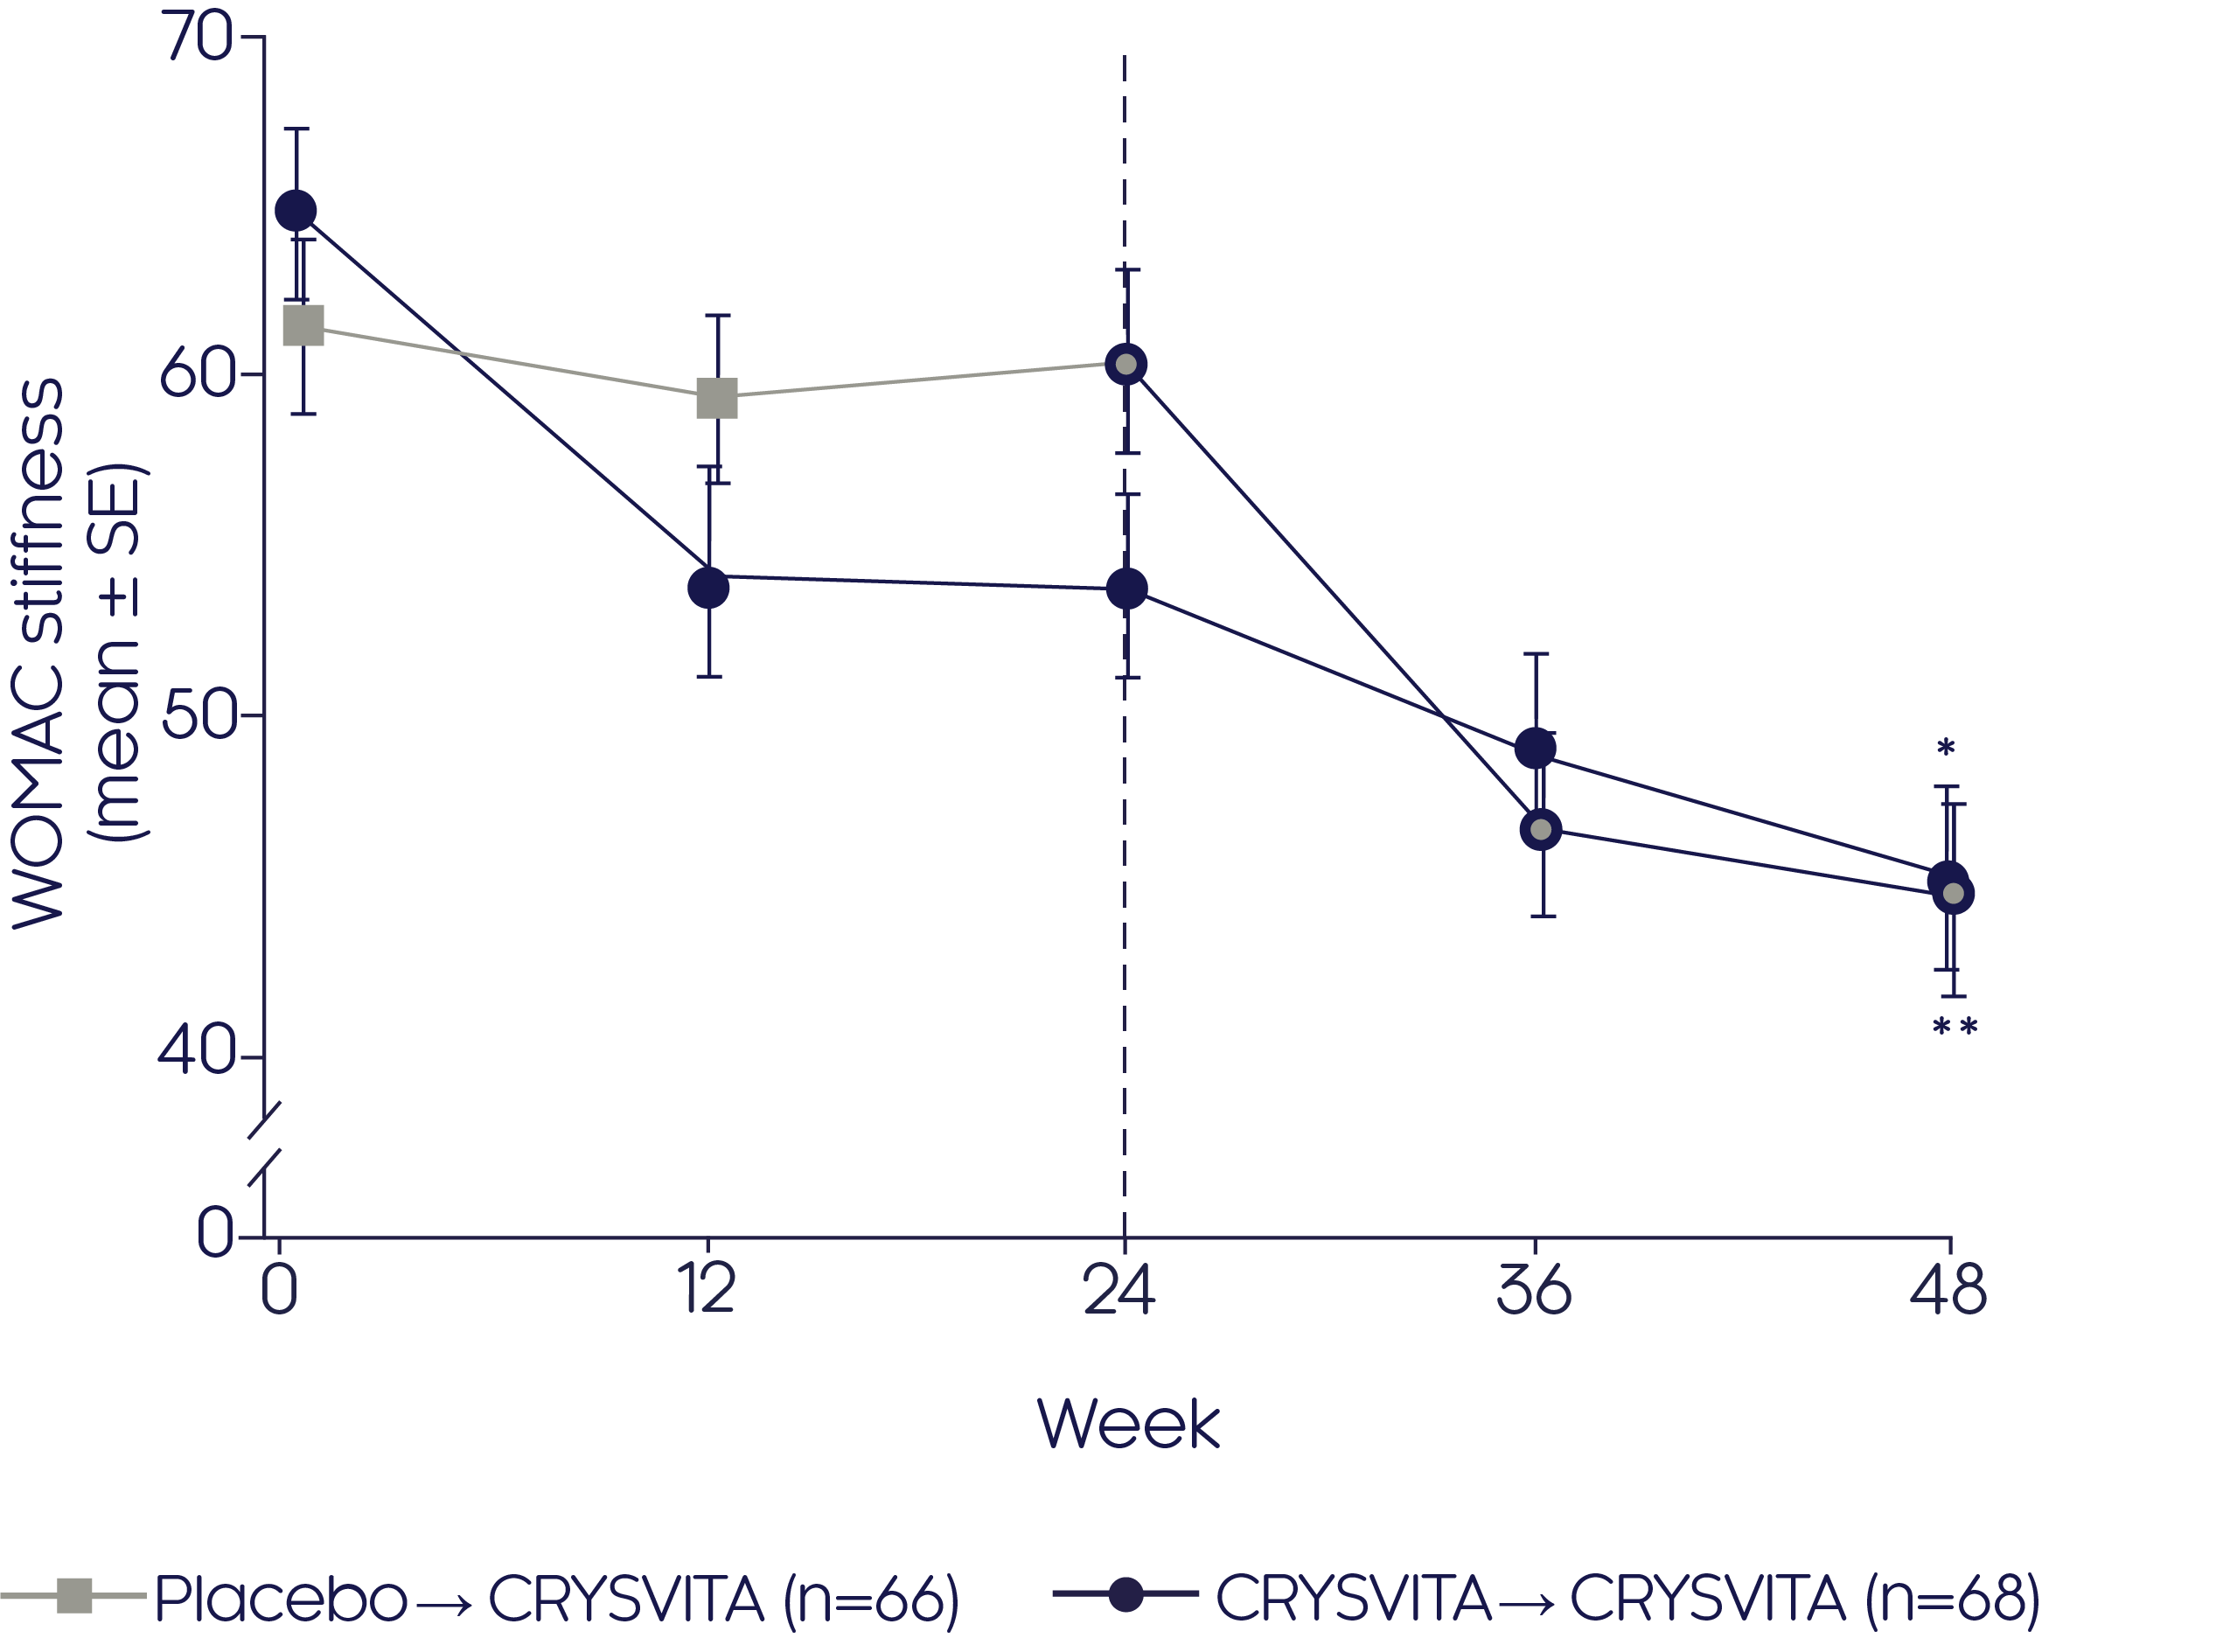
CRYSVITA® significantly (p<0.001) reduced the WOMAC stiffness score at Week 24 compared with placebo1
Mean change in WOMAC stiffness score2
Adapted from Portale AA, et al, 20192
- Significant (p<0.001) improvements were seen from baseline to Week 48 in the CRYSVITA®-CRYSVITA® group2
- CRYSVITA® also significantly (p<0.0001) improved stiffness according to the WOMAC score in those patients who switched from placebo to CRYSVITA® from Week 24 to Week 482
*p<0.001 for LS mean change from baseline to Week 48 (CRYSVITA® → CRYSVITA®), **p<0.001 for LS mean change from Weeks 24 to 48 (placebo → CRYSVITA®).
CRYSVITA® significantly (p<0.001) improved the WOMAC physical function impairment score from baseline to Week 48 in the CRYSVITA®- CRYSVITA® group2
Mean change in WOMAC physical function score2

Adapted from Portale AA, et al, 20192
*p<0.001 for LS mean change from baseline to Week 48 (CRYSVITA® → CRYSVITA®), **p<0.001 for LS mean change from Weeks 24 to 48 (placebo → CRYSVITA®).
CRYSVITA® significantly (p<0.001) improved mobility, shown by increased functional exercise capacity (measured by the 6MWT) from baseline to Week 48 in the CRYSVITA®- CRYSVITA® group2
Mean change in total distance walked in 6MWT2

Adapted from Portale AA, et al, 20192
- CRYSVITA® also significantly (p<0.001) improved mobility, shown by increased functional exercise capacity (measured by the 6MWT) in those patients who switched from placebo to CRYSVITA® from Week 24 to Week 482
*p<0.001 for LS mean change from baseline to Week 48 (CRYSVITA® → CRYSVITA®), **p<0.001 for LS mean change from Weeks 24 to 48 (placebo → CRYSVITA®).
Fractures and pseudofractures
Fractures/pseudofractures heal more quickly in adults with XLH treated with CRYSVITA® 2
In adults with XLH treated with CRYSVITA®, 63% of active fractures and pseudofractures at baseline were fully healed at Week 48 (p value NR)2
Proportion of baseline active fractures and pseudofractures fully healed2

Pseudofracture healing in a 38-year-old woman treated with CRYSVITA®1

Bone remodelling
CRYSVITA® improved key markers of bone remodelling2
- At Week 48, CRYSVITA® showed an improvement in markers of bone remodelling (P1NP and CTx [p<0.05] and BALP [p=ns]) from baseline2
| Bone remodelling marker | Placebo → CRYSVITA® group2 | CRYSVITA® → CRYSVITA® group2 |
|---|---|---|
| P1NP, LS mean (95% CI) | 76.9 ng/mL (54.9, 98.9) | 35.7 ng/mL (17.5, 53.9) |
| CTx, LS mean (95% CI) |
295.9 pg/mL (200.8, 391.1) |
127.1 pg/mL (36.7, 217.5) |
| BALP, LS mean (95% CI) |
6.7 μg/L (2.6, 10.7) |
1.2 μg/L (−2.3, 4.8) |
- In the CRYSVITA® → CRYSVITA® group, the largest increase in all three parameters was seen at the first post-baseline measurement, with subsequent attenuation and stabilisation of the effect of CRYSVITA® over 48 weeks2
- In the placebo → CRYSVITA® group, the largest increase in all three parameters was seen at the first assessment after initiation of CRYSVITA® at Week 242
Safety (24 and 48 Weeks)
CRYSVITA® was well tolerated and had an acceptable safety profile up to 48 weeks in adults with XLH2
- Adverse events in the CRYSVITA® group were similar to those in the placebo group with respect to incidence, nature and severity2
- The majority of adverse events were mild to moderate in severity2
- Hyperphosphataemia was observed in 7% of participants during CRYSVITA® treatment, but without clinical manifestations, which then resolved after dose reduction2
| Double-blind treatment period2 |
Any exposure to CRYSVITA®2 |
|||
|---|---|---|---|---|
| Patient incidence of AEs, n (%) |
Placebo n=66 Weeks 0–24 |
CRYSVITA® n=68 Weeks 0–24 |
Placebo → CRYSVITA® n=66 Weeks 24–cutoff |
CRYSVITA® → CRYSVITA® n=68 Weeks 0–cutoff |
| Any TEAE | 61 (92.4) | 64 (94.1) | 63 (95.5) | 68 (100) |
| Related TEAE† | 26 (39.4) | 30 (44.1) | 32 (48.5) | 42 (61.8) |
| Serious TEAE | 2 (3.0) | 2 (2.9) | 8 (12.1) | 7 (10.3) |
| Grade 3 or 4 TEAE | 9 (13.6) | 8 (11.8) | 14 (21.2) | 15 (22.1) |
| Related serious TEAE† | 0 | 0 | 0 | 0 |
| TEAE led to study discontinuation | 0 | 0 | 0 | 0 |
| TEAE led to treatment discontinuation | 0 | 0 | 0 | 0 |
| TEAE led to death | 0 | 0 | 0 | 0 |
†TEAEs classified by the investigator as possibly related, probably related, or definitely related.
Phase III bone histomorphometric measures of osteomalacia
Phase III study
Efficacy and safety of CRYSVITA® in improving osteomalacia in adults with XLH have been investigated in a phase III study3
Study design3
An open-label, single-arm, multicentre, international, phase III study was conducted to investigate the efficacy and safety of CRYSVITA® in improving osteomalacia in adults with XLH who had not been treated for at least 2 years before enrolment. Subjects were treated with CRYSVITA® every 4 weeks (Q4W) for at least 96 weeks.
| Study population (N=14):3 | |
|---|---|
| Aged 18 to 65 years | TmP/GFR <2.5 mg/dL |
| A diagnosis of XLH supported by a confirmed PHEX mutation or serum intact FGF23 level >30 pg/mL | BPI worst pain score ≥4 |
| Serum phosphate <2.5 mg/dL | No conventional therapy in the past 2 years |

†Transiliac crest bone biopsies (horizontal full-thickness biopsies of the ilium from a site 2 cm dorsal of the anterior superior iliac spine) were obtained at baseline and Week 48.3
Primary endpoint3
- The percentage change from baseline to Week 48 in osteoid volume/bone volume ratio based on analysis of transiliac crest bone biopsies
Secondary endpoints3
- Proportion of patients achieving mean serum phosphate levels above the LLN (2.5 mg/dL) at the mid-point of the dose interval as averaged across dose cycles between baseline and Week 24
- Percentage change from baseline in osteoid thickness, osteoid surface/bone surface and mineralisation lag time at Week 48
- Change from baseline over time in TmP/GFR and serum 1,25(OH)2D levels
- Change and percentage change from baseline over time in serum biochemical markers of bone remodelling, including P1NP, CTx and BALP
- Change from baseline over time in dynamic remodelling parameters: mineral apposition rate, mineralising surface/bone surface (MS/BS) and mineralising surface/osteoid surface (MS/OS)
Exploratory endpoints3
- Healing of active fractures and/or pseudofractures as defined by skeletal survey at baseline and subsequent targeted radiography
- Change from baseline to Week 48 in pain and fatigue based on the BPI and BFI, respectively
Safety endpoints3
- The incidence and severity of AEs and serious AEs, development of anti-CRYSVITA® antibodies, changes in ECHO and ECG, renal ultrasound nephrocalcinosis scores, fasting serum calcium, plasma iPTH and 24-hour urine calcium excretion
Patient characteristics at baseline3
| Characteristic | Total (N=14) |
|---|---|
| Mean age, years (SD) | 40.1 (8.7) |
| Female, n (%) | 8 (57.1) |
| Race, n (%) | |
| Asian | 4 (28.6) |
| Black or African American | 1 (7.1) |
| White | 9 (64.3) |
| Weight, kg, mean (SD) | 70.3 (22.0) |
| Height, cm, mean (SD) | 150.4 (9.0) |
| Body mass index, kg/m2, mean (SD) | 30.8 (8.5) |
| Serum phosphate, mg/dL, mean (SD)† | 2.2 (0.4) |
| TmP/GFR, mg/dL, mean (SD)† | 1.9 (0.3) |
| Serum 1,25(OH)2D, pg/mL, mean (SD)† ‡ | 37 (12) |
| Presence of osteomalacia, n (%) | 11 (78.6) |
| Bowing of the upper, lower, or both extremities, n (%) | 14 (100) |
| Radiographic evidence of a healed fracture, n (%) | 6 (43.0) |
| Active pseudofractures, n (%) | 4 (29.0) |
| Osteoarthritis, n (%) | 8 (57.0) |
| Dental disease, n (%) | 13 (93.0) |
| Prior orthopaedic surgery, n (%) | 11 (79.0) |
| Prior conventional therapy (≥2 years before enrolment) | |
| Oral phosphate salts and active vitamin D metabolites, n (%) | 12 (86.0) |
| Active vitamin D metabolites alone, n (%) | 1 (7.1) |
| No conventional therapy, n (%) | 1 (7.1) |
Adapted from Insogna KL, et al, 20193
†Normal ranges: phosphate, 2.5–4.5 mg/dL; 1,25(OH)2D, 18–72 pg/mL; TmP/GFR, 2.5–4.2 mg/dL.1 ‡n=12.
Most subjects received conventional therapy before the age of 18 years, with the mean duration of oral phosphate and active vitamin D being 13 and 15 years, respectively.
CRYSVITA® restores phosphate homeostasis in adults with XLH3
CRYSVITA® increased serum phosphate concentration from baseline over 48 weeks3
Mean change in serum phosphate3

Adapted from Insogna KL, et al, 20193
Normal range of serum phosphate is 2.5–4.5 mg/dL.
CRYSVITA® increased TmP/GFR† from Week 2; the TmP/GFR remained above baseline through to Week 483
Mean change in TmP/GFR3

Adapted from Insogna KL, et al, 20193
†Normal range of TmP/GFR is 2.5–4.5 mg/dL.
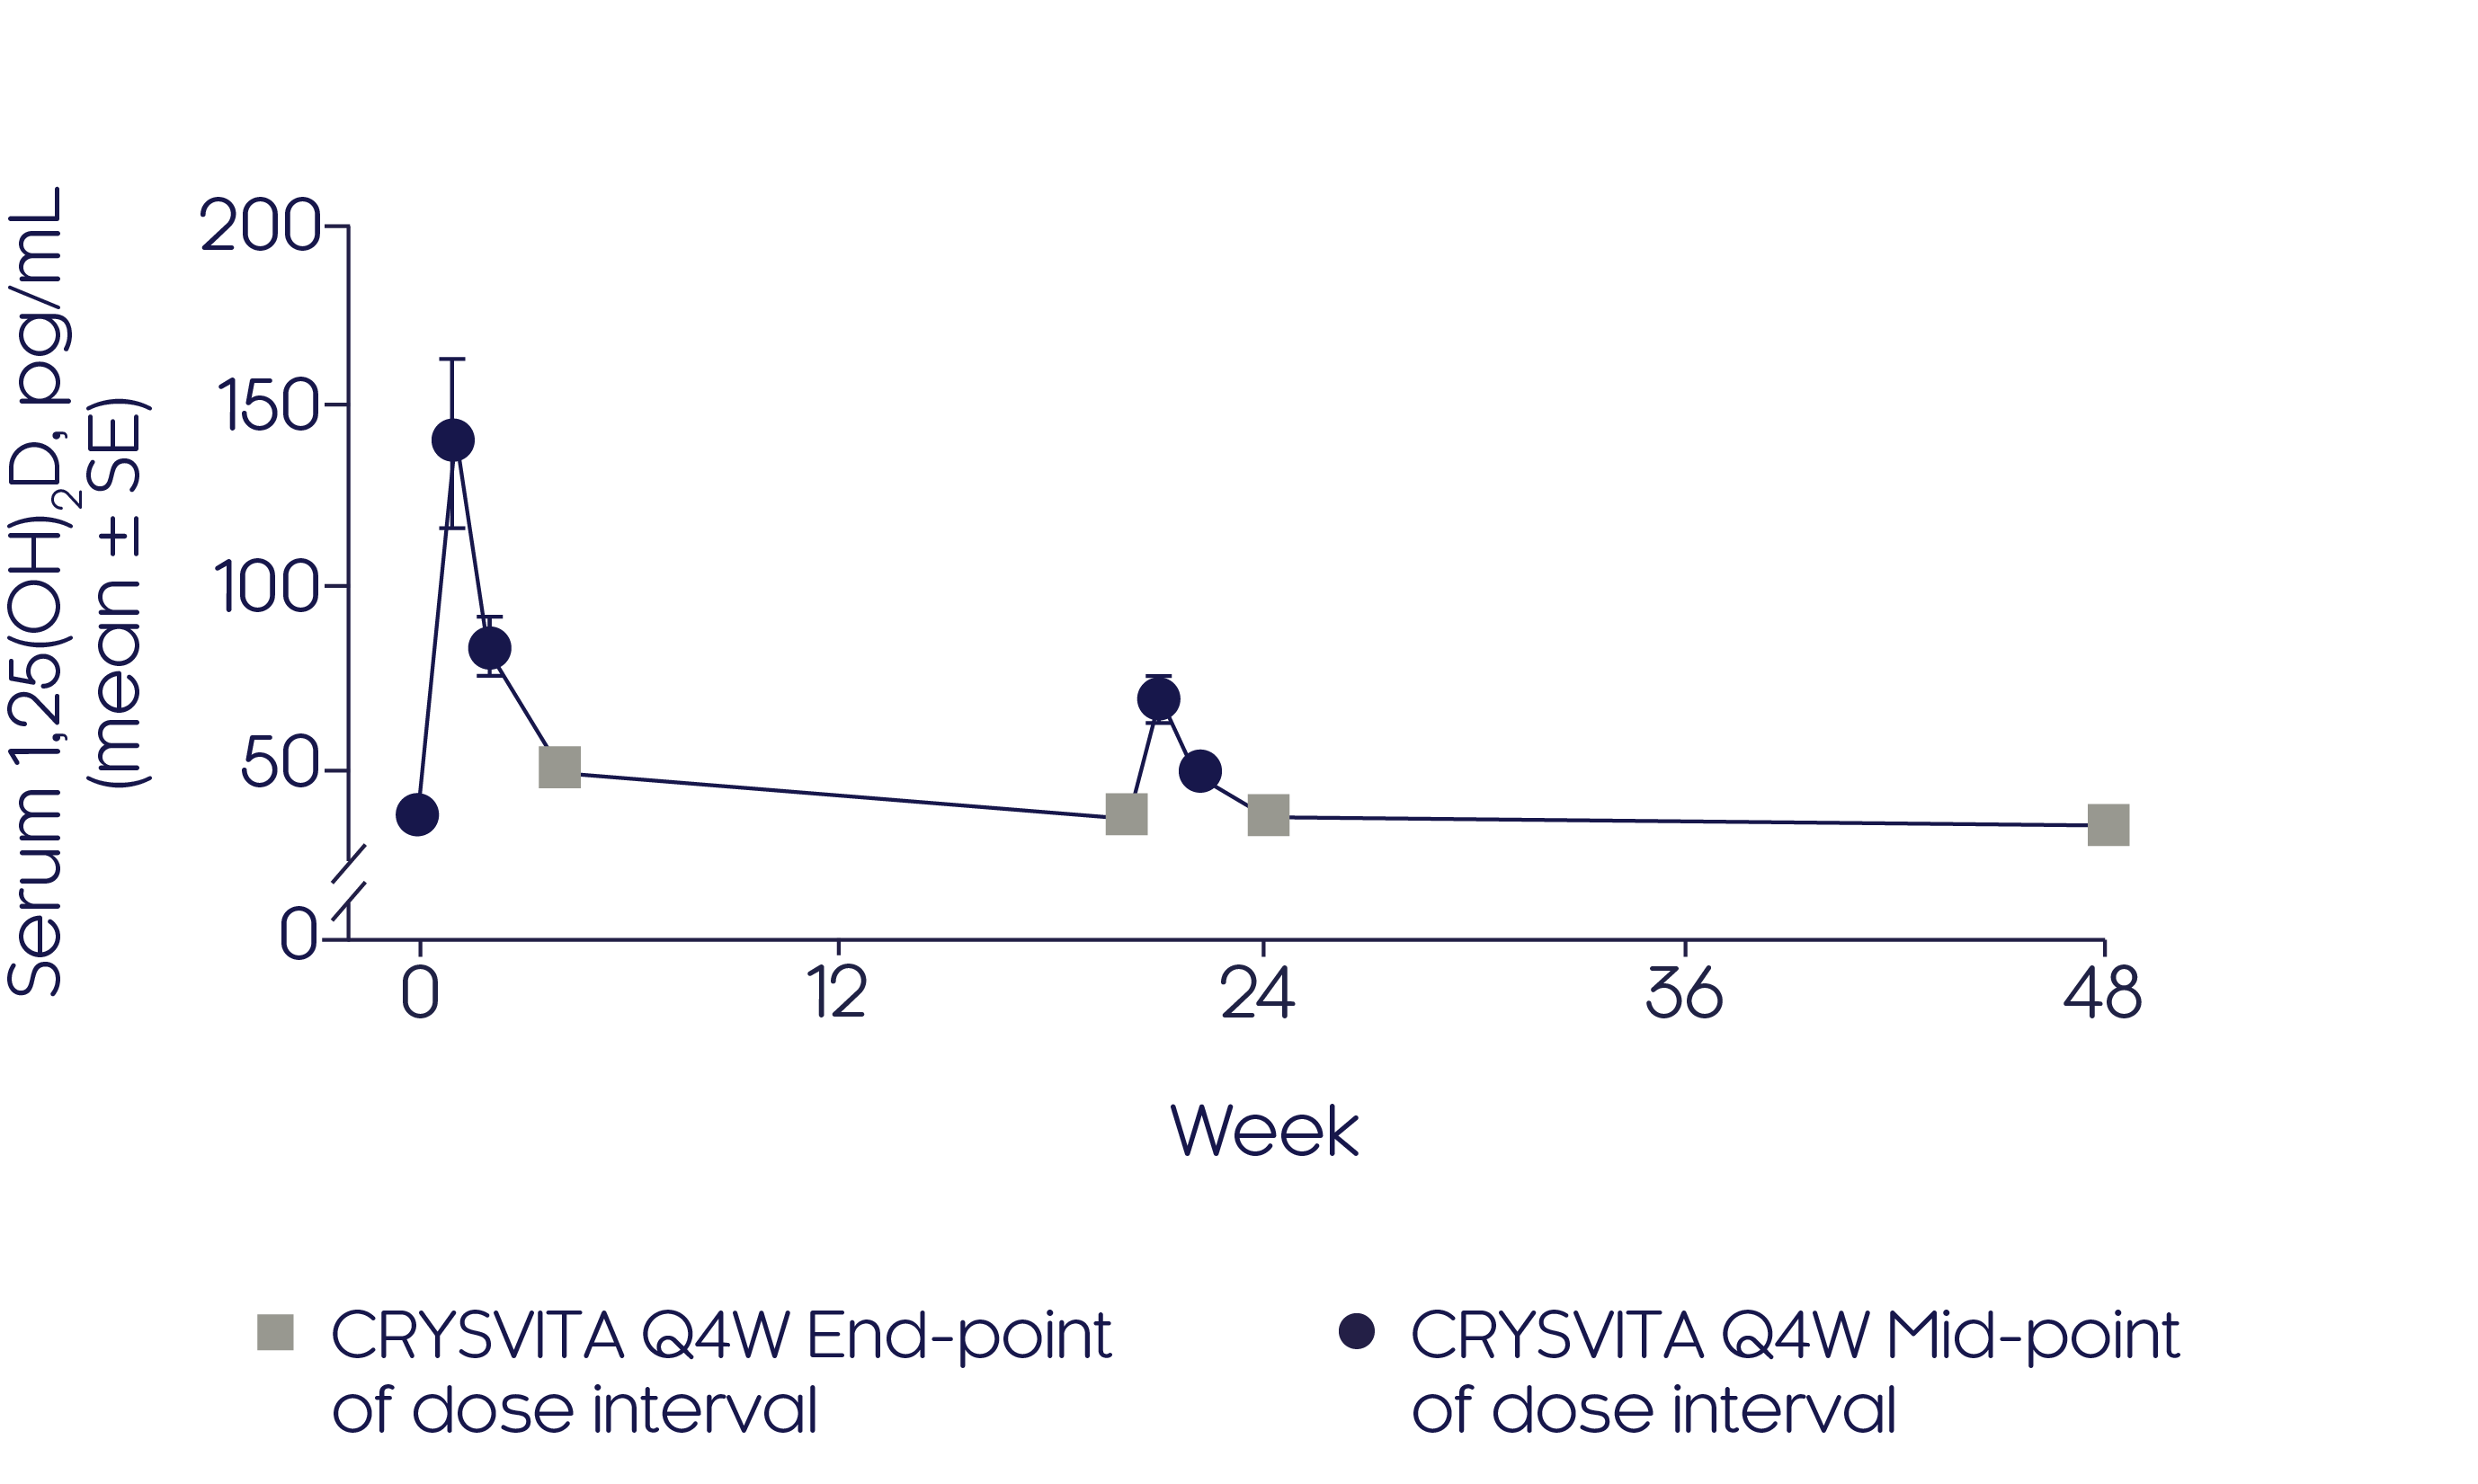
CRYSVITA® initially increased serum 1,25(OH)2D concentration3
- After initiation of CRYSVITA® treatment, mean serum 1,25(OH)2D concentrations were highest at Weeks 1 and 2 but declined to near baseline level at Week 43
- A similar pattern was observed at mid-dose between Weeks 20 and 24, albeit to a much lesser extent
Mean change in serum 1,25(OH)2D3
Adapted from Insogna KL, et al, 20193
Phosphate regulation
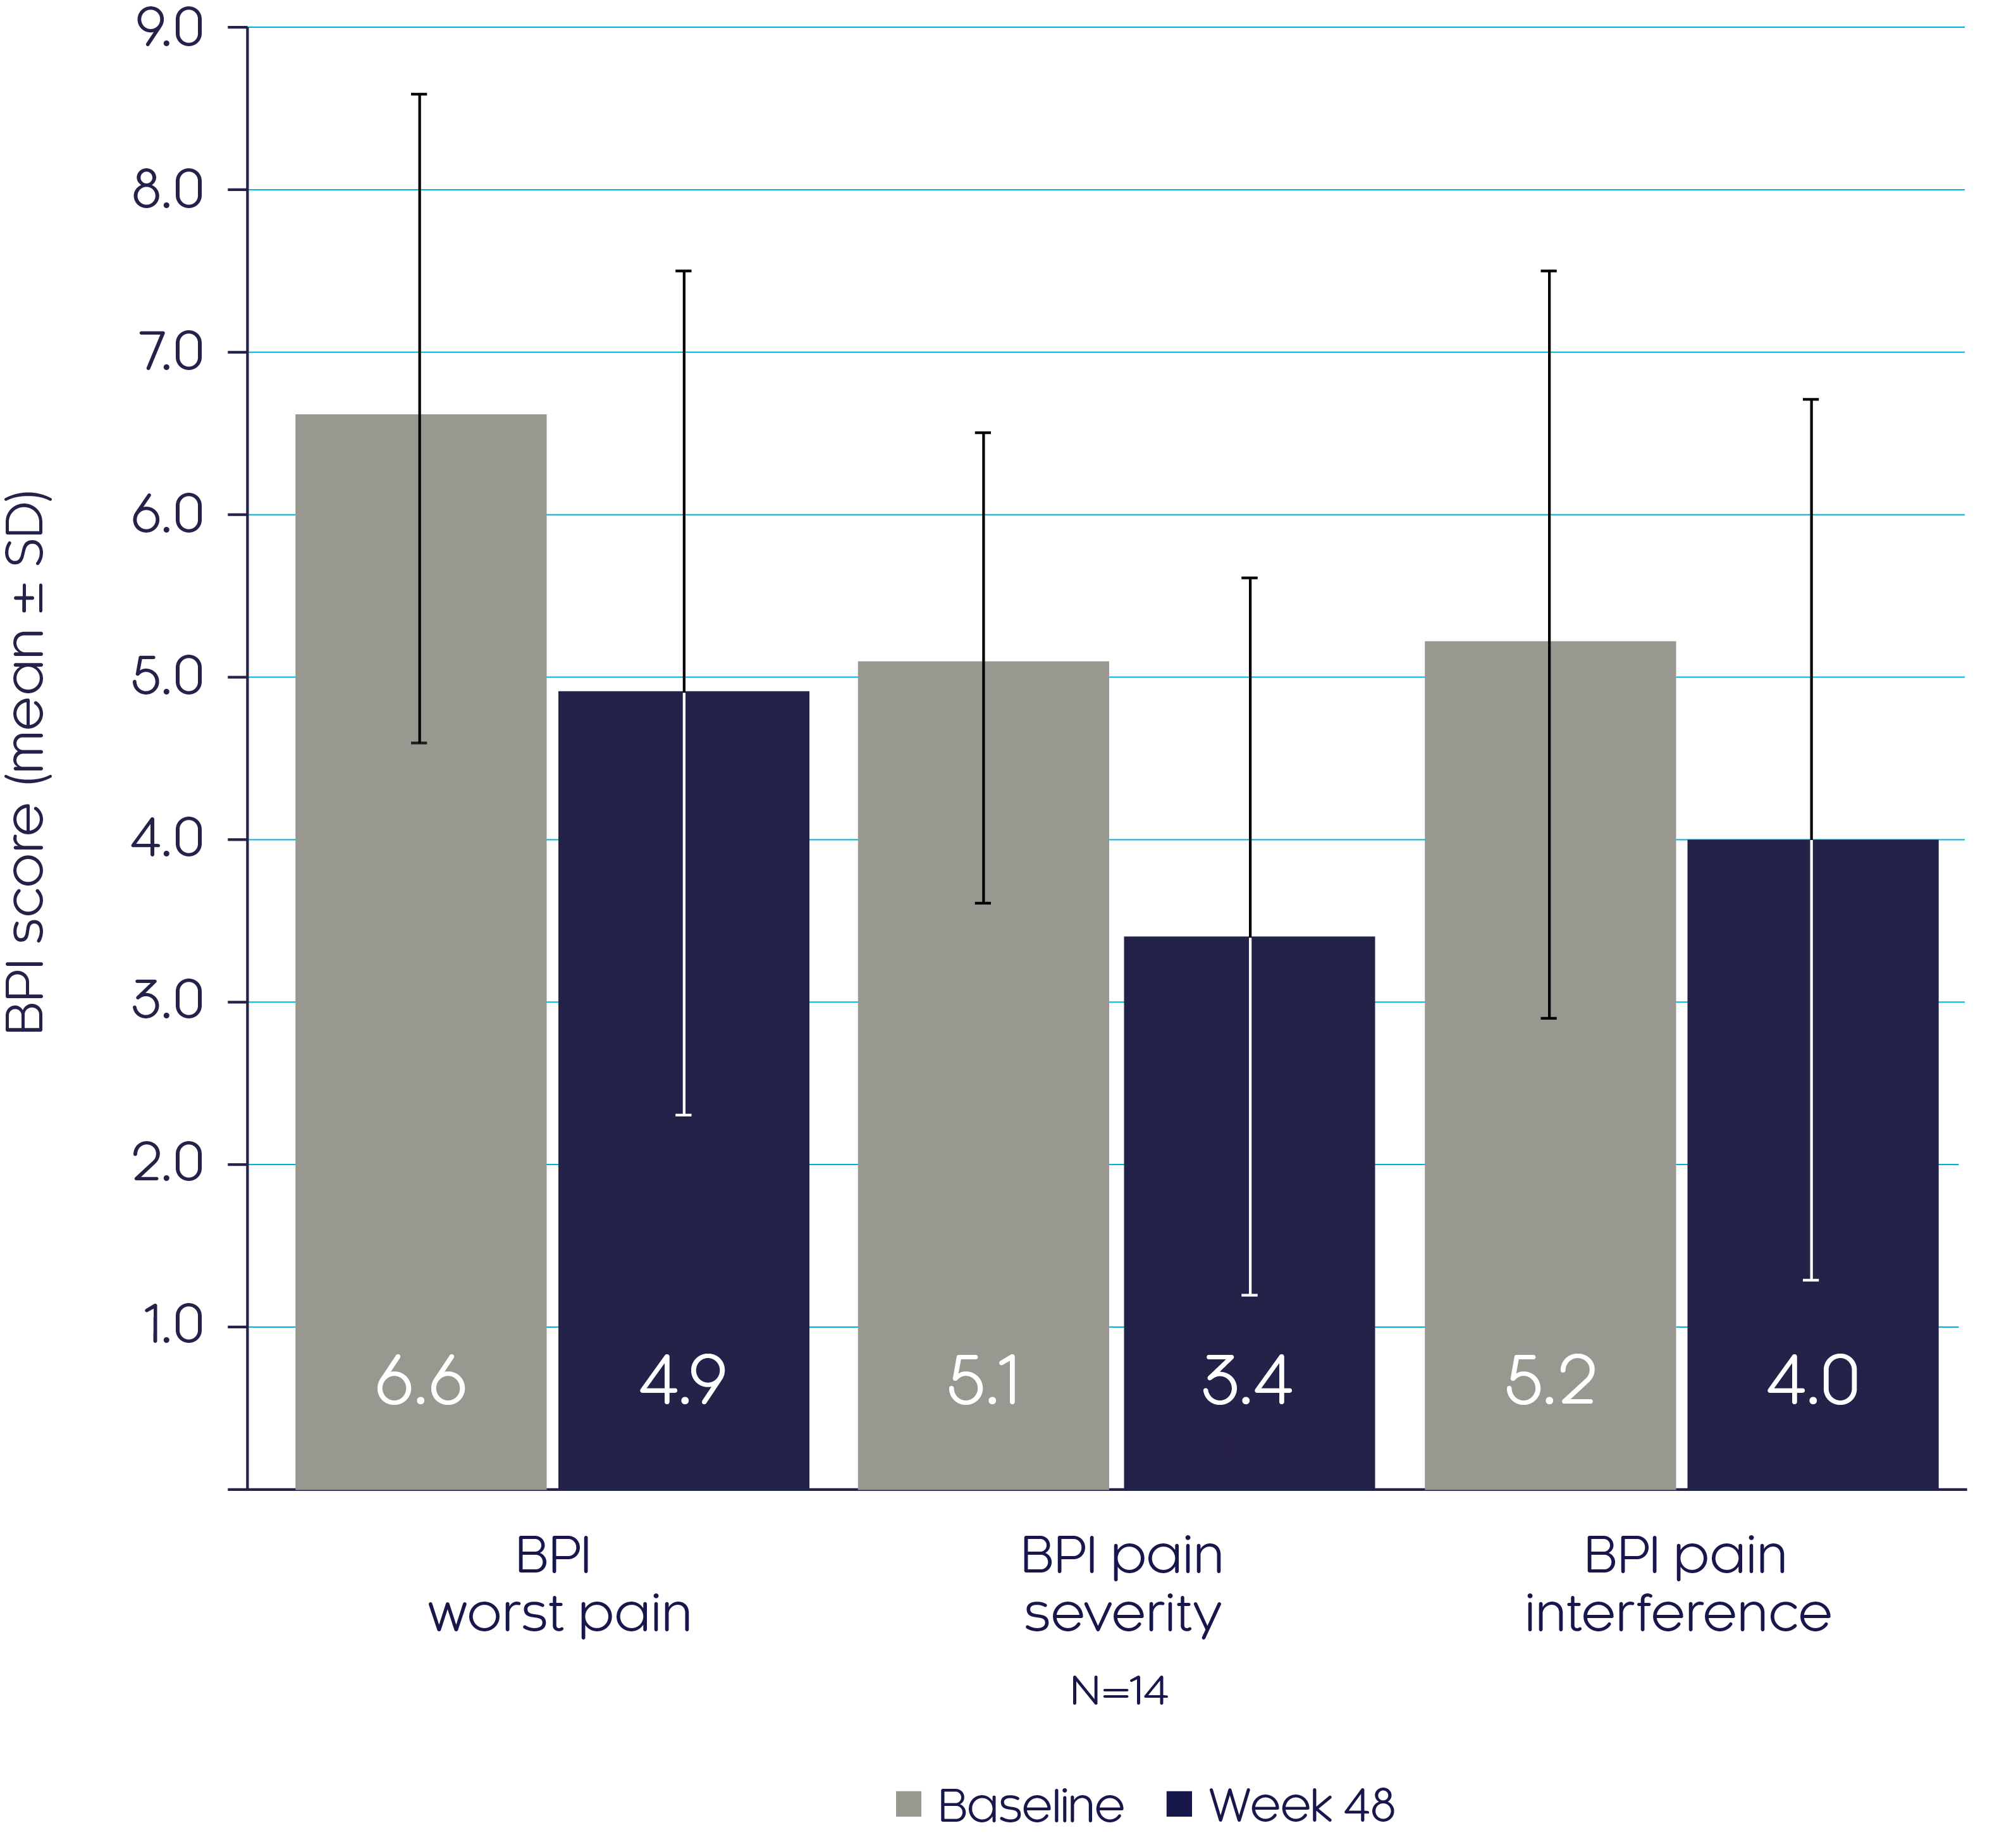
CRYSVITA® improves pain and fatigue in adults with XLH33
CRYSVITA® improved pain as shown by a decrease in BPI subscores from baseline to Week 483
BPI scores
Pain and fatigue
Adapted from Insogna KL, et al, 20193
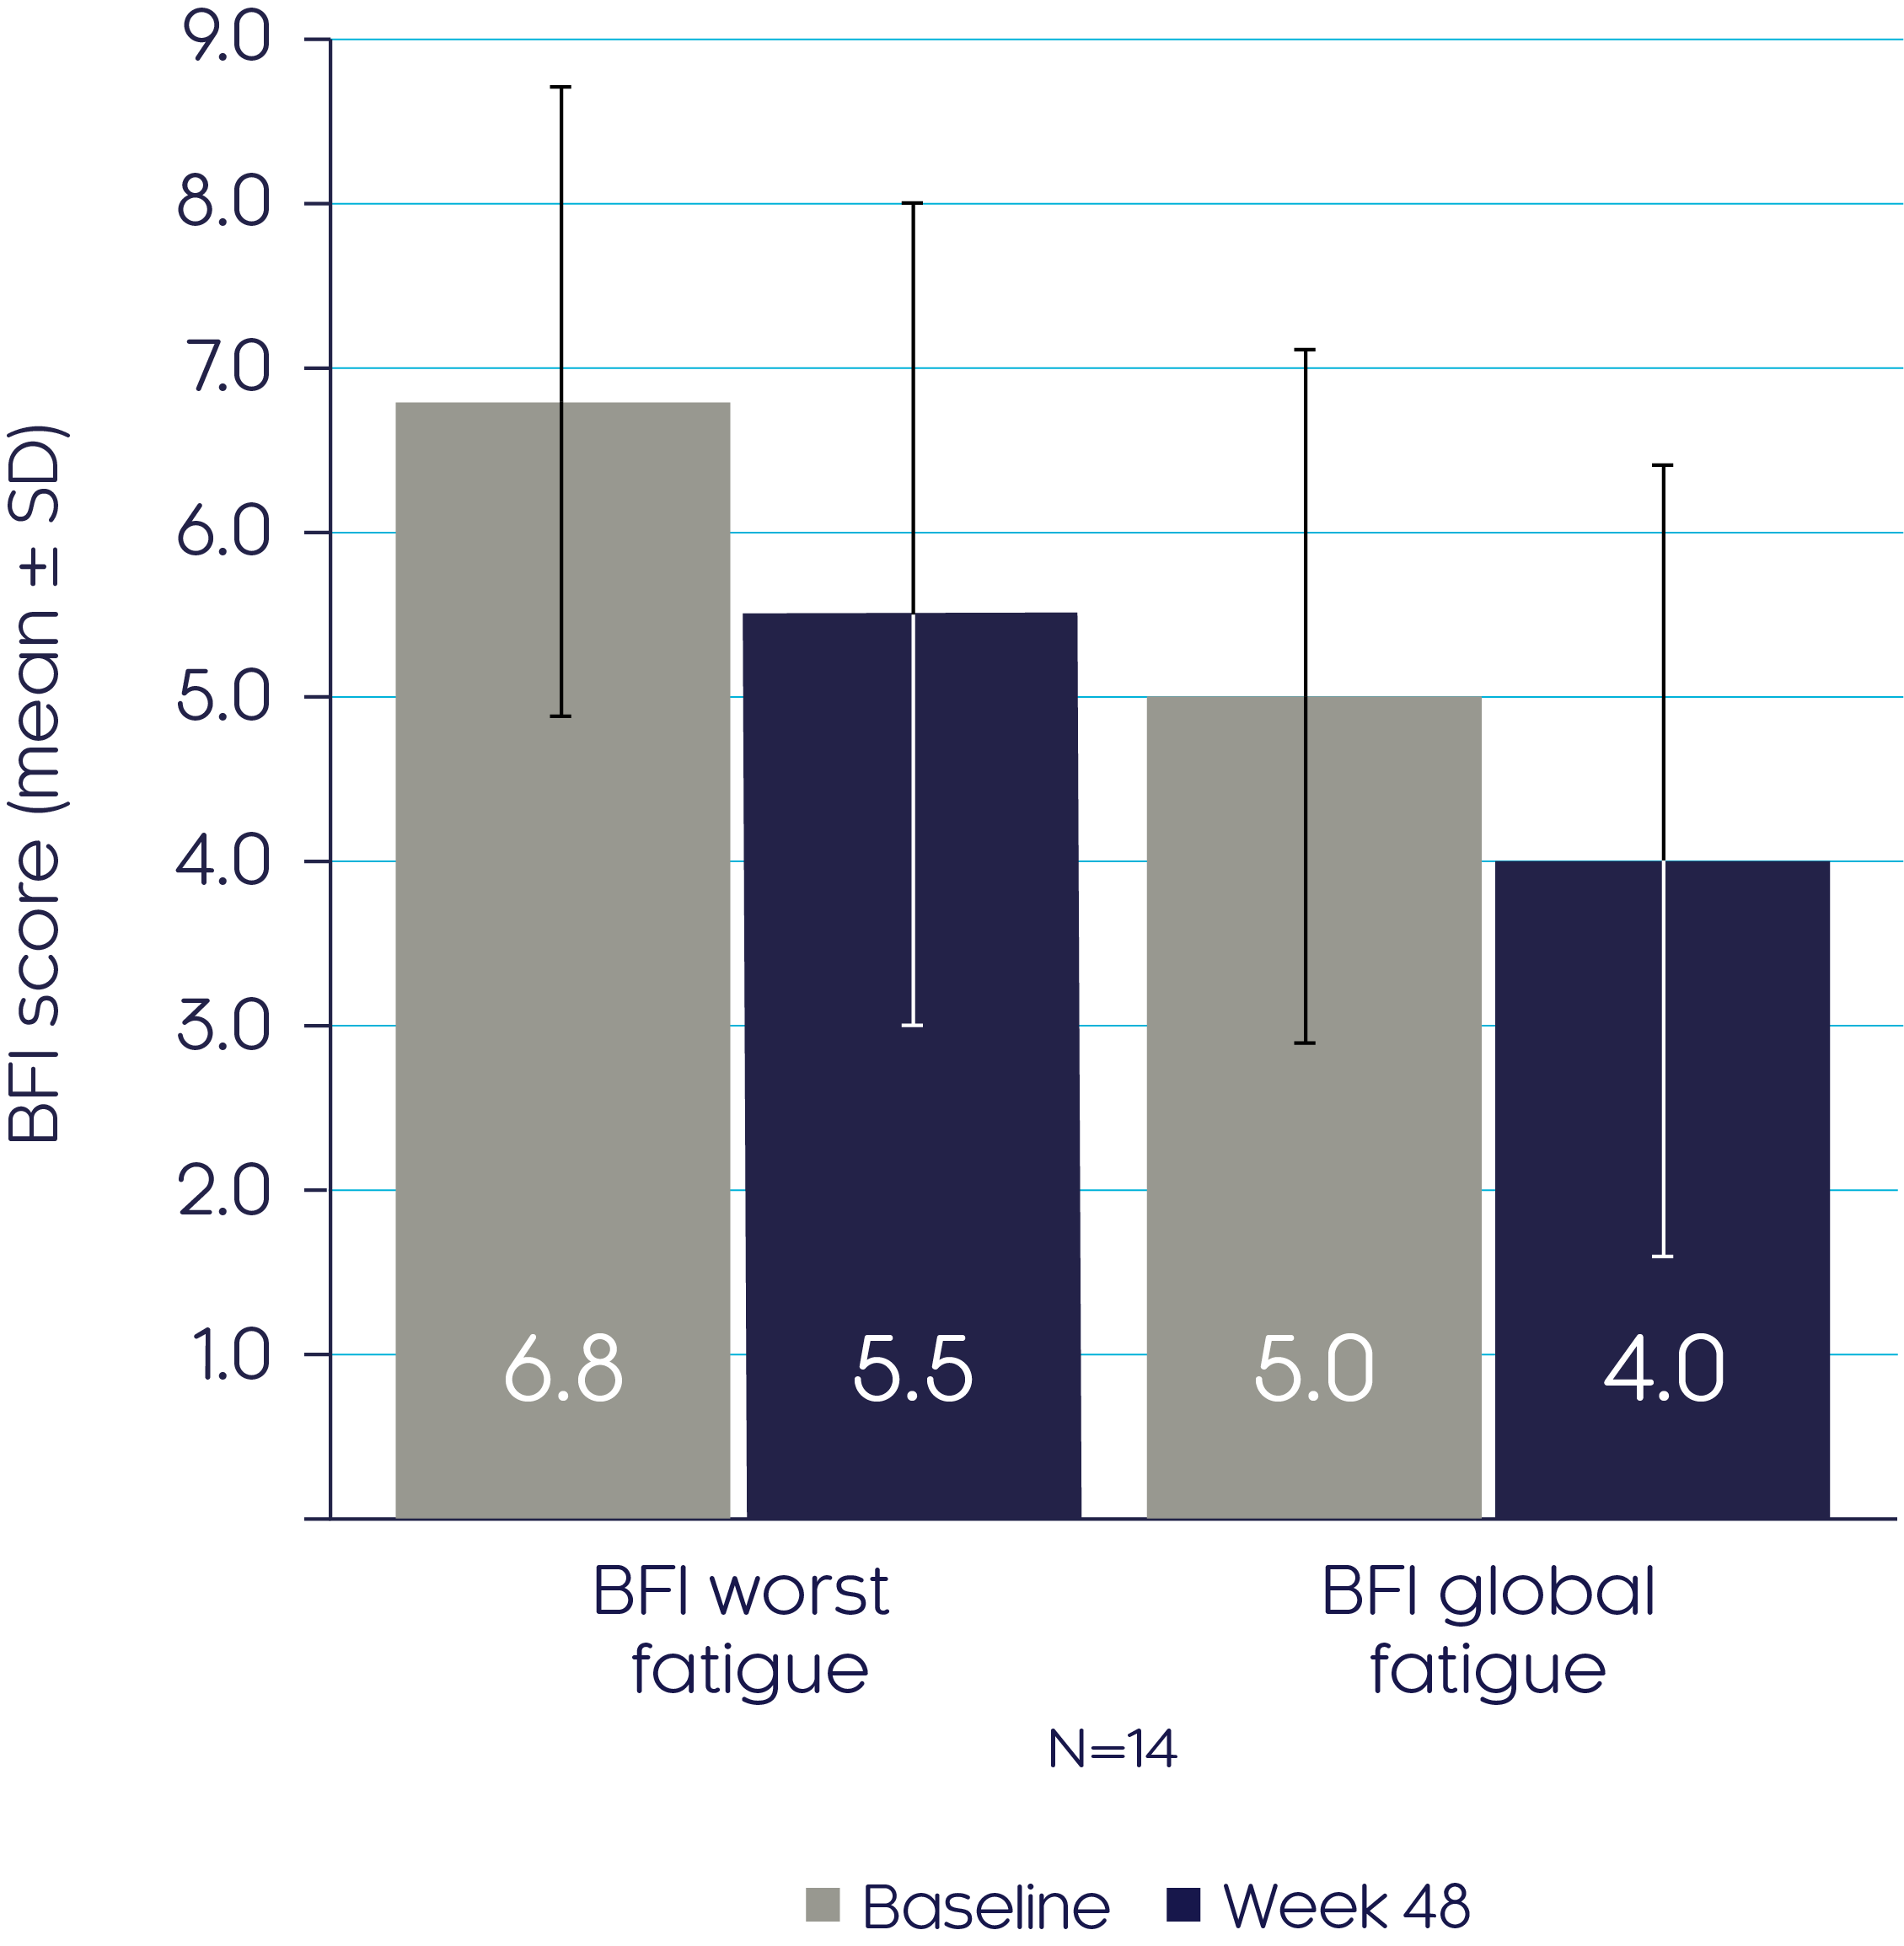
CRYSVITA® improved fatigue as shown by a decrease in BFI subscores from baseline to Week 483
BFI scores
Adapted from Insogna KL, et al, 20193
Bone biopsy measurements before and after treatment show that CRYSVITA® improves bone quality and enhances bone mineralisation in adults with XLH3
Osteomalacia-related histomorphometrics
At Week 48, CRYSVITA® improved bone quality, which was the primary endpoint, demonstrated by a mean reduction in osteoid volume/bone volume and osteoid surface/bone surface of 54% (p<0.001) and 26% (p=0.0002) respectively3
Osteoid Volume/
Bone Volume3
Osteoid Surface/
Bone Surface3

Adapted from Insogna KL, et al, 20193
Data presented as median (marked by the horizontal line within the box plot), interquartile and range.
†The dashed line indicates ULN reference ranges for : osteoid volume/bone volume (3.05%); osteoid surface/bone surface (23.9%). Histomorphometric endpoints were analysed using a two-sided t-test. If the normal assumption was not met, a sign test for median was used.
At Week 48, CRYSVITA® enhanced mineralisation, shown by a mean reduction in osteoid thickness of 32% (p<0.0001) and a reduced mineralisation lag time (p=ns)3
Pseudofractures
Mineralisation lag time3
Osteoid thickness3

Adapted from Insogna KL, et al, 20193
Data presented as median (marked by the horizontal line within the box plot), interquartile and range.
†The dashed line indicates ULN reference ranges for : mineralisation lag time (28.6 days) and osteoid thickness (8.9 μm). Histomorphometric endpoints were analysed using a two-sided t-test. If the normal assumption was not met, a sign test for median was used
CRYSVITA® is associated with healing of pseudofractures3
Bone remodelling (biochemical and dynamic)
- By Week 12, two of the four active pseudofractures identified at baseline (n=4) had healed completely and two had partially healed3
- By Week 48, three of the four active pseudofractures had healed, and the remaining pseudofracture was not evaluable due to a missing radiograph3
CRYSVITA® improves biochemical and dynamic markers of bone remodelling3
CRYSVITA® increased serum P1NP and serum CTx levels at Week 48, suggesting improvement in bone remodelling and formation3
- CRYSVITA® treatment significantly increased levels of P1NP at Week 48 vs baseline3
- LS mean increase of 77% (LS mean ± SE change 52.5 ± 11.6 ng/mL; p<0.0001)
- CRYSVITA® treatment significantly increased levels of CTx at Week 48 vs baseline3
- LS mean increase of 36% (LS mean ± SE change 175.1 ± 44.0 pg/mL; p<0.0001)
- With CRYSVITA®, the highest levels of BALP were found at Week 123
- At Week 12, the LS mean increase from baseline was 53% (LS mean ± SE change 10.9 ± 3.5 μg/L; 95% CI, 4.0 to 17.9)
- At Week 48, the LS mean increase from baseline was 24% (4.5 ± 4.0 μg/L; p=0.26)
CRYSVITA® improved dynamic remodelling parameters at Week 483
| UX023-CL3043 |
Healthy adult reference range† Mean ± SD; median (min, max)3 |
||
|---|---|---|---|
| Parameter | n |
Mean ± SD; median (min, max) | |
| Mineral apposition rate (µm/day) | 0.75 ± 0.09; 0.77 (0.57, 0.86) | ||
| Baseline | 11 | 0.58 ± 0.45; 0.43 (0.3, 1.8) | |
| Week 48 | 11 | 0.62 ± 0.19; 0.60 (0.3, 1.0) | |
| MS/BS (%) | 7.9 ± 2.7; 8.3 (3.3, 12.4) | ||
| Baseline | 11 | 6.0 ± 4.8; 3.3 (1.0, 12.9) | |
| Baseline | 11 | 6.0 ± 4.8; 3.3 (1.0, 12.9) | |
| Week 48 | 10 | 7.0 ± 3.7; 5.8 (2.2, 13.6) | |
| MS/OS (%) | 57.9 ± 13.8; 59.2 (39.9, 74.9) | ||
| Baseline | 11 | 6.5 ± 5.1; 3.7 (1.1, 13.8) | |
| Week 48 | 10 | 10.8 ± 6.1; 8.1 (4.0, 20.3) | |
Adapted from Insogna KL, et al, 20193
†Healthy reference range is based on data from 8 to 12 individuals between the ages of 17.0 and 22.9 years who underwent surgery for reasons independent of abnormalities in bone development and metabolism.
Safety (48 Weeks)
CRYSVITA® was well tolerated and had an acceptable safety profile up to 48 weeks in adults with XLH3
| Category | Incidence for all patients (N=14)† n (%)3 |
|---|---|
| Any TEAE | 14 (100) |
| Related TEAE | 10 (71.4) |
| Injection-site urticaria | 3 (21.4) |
| Abdominal pain | 2 (14.3) |
| Asthenia | 2 (14.3) |
| Injection-site pain | 2 (14.3) |
| Injection-site reaction | 2 (14.3) |
| Serious TEAE | 2 (14.3) |
| Paraesthesia | 1 (7.1) |
| Migraine | 1 (7.1) |
| Category | Incidence for all patients (N=14)† n (%)3 |
|---|---|
| Related serious TEAE | 0 |
| Grade 3 or 4 TEAE | 3 (21.4) |
| Paraesthesia | 1 (7.1) |
| Migraine and arthralgia | 1 (7.1) |
| Uterine haemorrhage | 1 (7.1) |
| TEAE leading to study discontinuation | 0 |
| TEAE leading to treatment discontinuation | 0 |
| TEAE leading to death | 0 |
Adapted from Insogna KL, et al, 20193
†Patients who completed at least 48 weeks of CRYSVITA® treatment, but no more than 84 weeks.
1. Insogna KL, et al. J Bone Miner Res. 2018;33:1383–93. 2. Portale AA, et al. Calcif Tissue Int. 2019;105:271–84. 3. Insogna KL, et al. J Bone Miner Res. 2019;34:2183–91.
